
What Is Flow Cytometry Software and How Does It Work?
Flow cytometry software turns fluorescent signals into interpretable biological evidence. It receives data from individual cells, often stored as FCS files, then supports compensation, gating, quality control, and statistical comparison. The workflow sounds simple. It is not.
Howard M. Shapiro, a leading flow cytometry author, describes the technology as “a method for measuring the physical and chemical characteristics of cells or cell particles in a fluid as they pass one by one through a beam of focused light.” His definition explains why software matters: every dot on a plot represents a measurement, not merely an attractive visual. Reliable software must preserve raw data, document analysis steps, and expose questionable thresholds. A careless gate can change the reported percentage of positive cells within minutes.
Market evidence shows why this field continues expanding. Fortune Business Insights valued the global flow cytometry market at approximately USD 5.76 billion in 2024 and projected continued growth through 2032. Grand View Research also identifies rising demand for high-throughput analysis, automation, and advanced clinical workflows. These trends increase pressure on laboratories to connect instruments, databases, and reporting systems without losing traceability.
Good flow cytometry software supports reproducible decisions. It can flag compensation errors, compare batch controls, and generate audit-ready reports. Still, software cannot repair poor staining, weak controls, or an unsuitable antibody panel. That limitation deserves attention. The strongest platform is not always the one with the most buttons. It is the one analysts can understand, validate, and consistently defend.
What Is Flow Cytometry Software?
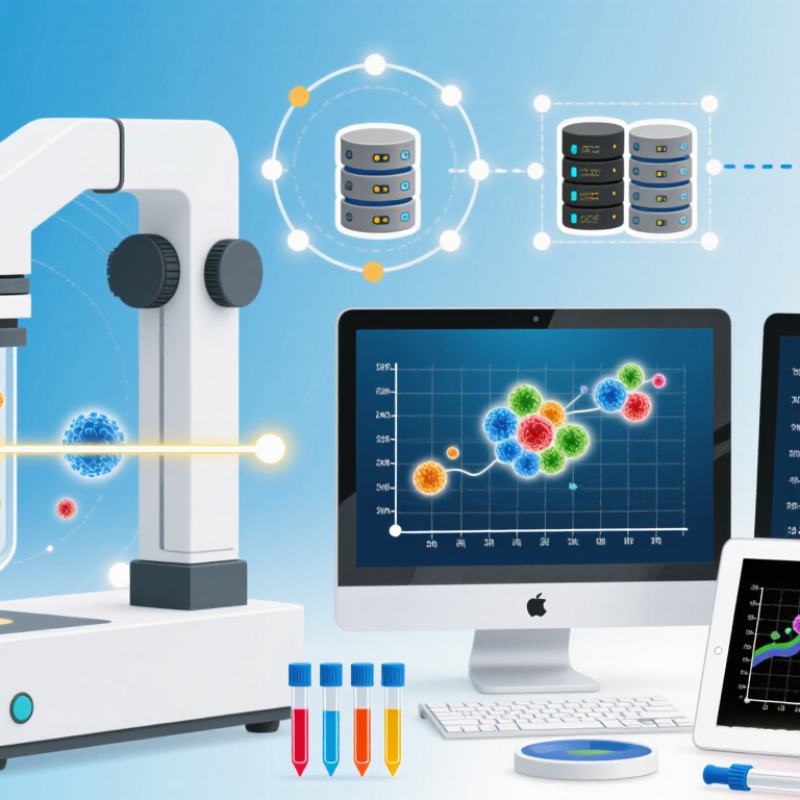
Flow cytometry software is the digital layer that turns detector signals into interpretable cellular data. A flow cytometer measures light scatter and fluorescence as cells pass through a laser beam. The software records these signals, organizes them, and displays patterns on charts. It helps researchers inspect thousands of cells within seconds.
Common functions include compensation, gating, quality checks, and statistical analysis. Compensation corrects spectral overlap between fluorescent signals. Gating lets users isolate populations, such as viable lymphocytes or marker-positive cells. Researchers can draw gates on dot plots, histograms, or density maps. The software then calculates percentages, fluorescence intensity, and cell counts. It can also compare samples and export traceable reports.
Good software does not replace scientific judgment. It supports it. A poorly placed gate can change the biological interpretation. Automated analysis may save time, but unusual samples still need human review. I have found that clear controls, consistent settings, and documented decisions improve confidence more than attractive graphics. Even experienced users can miss background signals or unstable measurements. That is why reliable workflows include calibration records, compensation checks, and repeated inspection of raw data. The process is powerful, but not flawless.
What Is Flow Cytometry Software and How Does It Work?
| Workflow Stage | What the Software Does | Typical Data Used | Common Analysis Methods | Primary Result |
|---|---|---|---|---|
| 1. Data Import | Loads and organizes flow cytometry data files for review and analysis. | FCS files containing event measurements, parameter names, detector information, and acquisition metadata. | File validationMetadata reviewBatch organization | A structured experiment workspace with accessible sample files. |
| 2. Parameter Review | Displays the measured parameters and helps users distinguish scatter signals from fluorescence signals. | Forward scatter, side scatter, fluorescence intensity, time, and optional instrument parameters. | Parameter selectionScale adjustmentSignal inspection | A suitable set of parameters for identifying cell populations. |
| 3. Compensation | Corrects for fluorescence spillover when emission from one fluorochrome is detected in another channel. | Single-stained controls, spillover values, fluorescence-minus-one controls, and sample measurements. | Compensation matrixControl comparisonSpillover correction | Adjusted fluorescence values that better represent each measured signal. |
| 4. Quality Control | Helps identify acquisition problems, unusual signal patterns, debris, unstable flow, or inconsistent samples. | Event rate, time parameter, signal distributions, detector values, and control sample results. | Outlier reviewSignal stabilityControl checks | A reviewed dataset with potential technical issues documented. |
| 5. Gating | Defines regions or rules to select cells and exclude unwanted events such as debris or aggregates. | Scatter characteristics, fluorescence intensity, viability markers, and biological markers. | Manual gatesHierarchical gatesBoolean gates | Selected cell populations for downstream measurement. |
| 6. Population Identification | Supports the classification of cell subsets based on marker expression and measured characteristics. | Marker-positive and marker-negative events, scatter properties, and sample group information. | Bivariate plotsHistogramsDensity plots | Defined populations such as live cells, immune subsets, or marker-positive cells. |
| 7. Advanced Analysis | Provides optional computational methods for discovering patterns across many parameters or samples. | Multi-parameter event data, population frequencies, marker intensities, and sample annotations. | ClusteringDimensionality reductionAutomated gating | Additional population relationships or patterns that may require biological interpretation. |
| 8. Statistical Comparison | Compares populations and measurements across experimental conditions or sample groups. | Cell percentages, event counts, median fluorescence intensity, and replicate information. | Group summariesFold comparisonStatistical testing | Quantitative comparisons supported by sample-level results. |
| 9. Visualization | Converts measurements into plots and charts that make cell populations and marker patterns easier to inspect. | Event-level measurements, gated populations, fluorescence distributions, and group labels. | Dot plotsContour plotsHistogramsHeat maps | Readable visual summaries of population structure and marker expression. |
| 10. Reporting and Export | Creates reproducible reports and exports processed results for documentation or further analysis. | Gate hierarchy, compensation settings, population statistics, plots, and sample metadata. | Report generationTable exportImage exportAudit trail | Shareable figures, tables, analysis settings, and documented conclusions. |
Related Posts
-
What is a cas9 antibody and how is it used?
-
How to Optimize Immunohistochemistry Staining for Best Results?
-
What is Antibody Engineering and How Does It Work?
-
What is 3D cell culture and why is it crucial for research?
-

China Top Rabbit Monoclonal Antibody Supplier?
-
10 Essential Tips for Mastering 3D Cell Culture Techniques?